Articles
On measuring relative poverty in Malaysia

Dr David Demery, Former Research Fellow, University of Bristol, United Kingdom

In an earlier article I described how Malaysia’s absolute poverty line income has evolved over time broadly in line with changing contemporary standards of living and consumption patterns (Demery, 2024). In this article, the focus is on measuring relative poverty. Measures of poverty are frequently used to formulate and support government pro-poor policies, for budgetary allocations, and to assess the efficacy of programmes. For these reasons care must be taken to ensure their validity and relevance.

The Department of Statistics–Malaysia (DOSM) currently publishes four key income standards:
  • a hard-core poverty line income: the income necessary to have enough food for survival;
  • an absolute poverty line income (PLI): the income necessary for essential food and non-food needs;
  • a relative poverty line income (rPLI): half the income of the average (or median) household; and
  • the income level required to achieve a ‘decent standard of living’, based on a methodology proposed by the International Labour Organization (ILO, 2021).

Recent average monthly income values for the four income standards are, in ascending order:
  • hard-core poverty line: RM1,198 in 2022;
  • absolute poverty line: RM2,589 in 2022;
  • relative poverty line: RM3,169 in 2022; and
  • decent standard of living: RM4,729 in 2023.

The hard-core and absolute poverty lines take full account of each household’s size and its demographic composition. Although the average absolute poverty line income was RM2,589 a month in 2022, each household has its own PLI, based on its state, urban/rural location, size, and demographic composition. A household is in absolute poverty if its income is less than its own PLI. The decent living standard also varies with household size, demographic composition, state, and urban/rural location.

In contrast to the three other Malaysian standards, a household is relatively poor if its total income is less than half the total income of the median household which, in 2022, was RM6,338 per month, half of which defines the relative poverty line income of RM3,169. No account is taken of the household’s size or composition.

This article examines measures of the relative poverty line income that take account of household size and composition. One alternative to basing the rPLI on total household income would be to base it on household income per member (that is, income per capita). This is a far preferable approach. However, as described below, the use of total household income as a measure of living standard ‘automatically associates poverty with small household size, just as the use of a per capita measure ensures the opposite—an overrepresentation of large households among the poor’ (Deaton and Muellbauer, 1986, p. 721). Another approach bases the rPLI on income per adult equivalent—‘equivalized income’—that takes account of both household size and its composition. This is the approach adopted in several countries, including the United Kingdom and European Union countries.
Housing of the Orang Asli, Malaysia’s relative poorest community, Selangor, 2015
Source:
Licensed image from Shutterstock, https://www.shutterstock.com

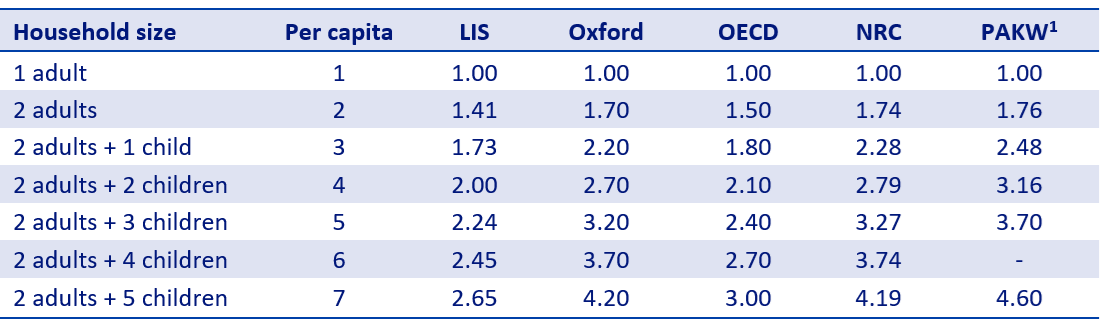
Defining adult-equivalent scales

Adult-equivalent scales answer the following question: how much additional income does a family need to reach the same standard of living as a one-member household? In answering the question, two features play a key role:
  1. Some household expenditures are on shared (‘public’) goods, like housing and furniture. Others are individual in nature (‘private’), like food and clothing. The well-known adage, ‘two can live as cheaply as one’, reflects the sharing of public goods. Larger households can take advantage of ‘economies of scale’.
  2. Children usually consume less than adults. So, for example, a household of two adults and a child will need less income than a household of three adults to achieve the same standard of living.

Deaton and Zaidi (2001) find that there are three broad approaches to defining the number of adult equivalents in a household:
  • One relying on behavioural analysis to estimate equivalence scales.
  • One based on direct questions to obtain subjective estimates.
  • One that sets adult-equivalent scales in some reasonable, but essentially arbitrary, way.

After reviewing the three, Deaton and Zaidi (2001, p. 50) conclude: ‘Given the current unreliability of either the behavioural or the subjective approach, there is much to be said for making relatively ad hoc corrections that are likely to do better than deflating by household size’.

A number of ad hoc equivalence scales have been proposed:
  • Luxembourg Income Study (LIS): the square root of the number of household members. The number of adult equivalents (AE) is defined as AE=√(A+K) where A and K are, respectively, the numbers of adults and children (less than 14 years old) in the household (Jesuit and Mahler, 2004). This approach is useful where the demographic characteristics of the household are not recorded.
  • OECD scale (Oxford): AE=1+0.7×(A-1)+0.5×K (OECD, 1982).
  • OECD modified scale (OECD): AE=1+0.5×(A-1)+0.3×K (Aldi et al., 1994). Additional adults and children in a household add less to the scale than the original OECD scale.
  • United States National Research Council scale (NRC): AE=(A+∝K)θ, where ∝ and θ are the key parameters to be determined (National Research Council, 1995).

Deaton and Zaidi (2001) adopt the NRC scale, ‘simply setting ∝ and θ at sensible values’. As a guide, they suggest that ∝ could be close to unity in industrialized countries where children can be costly, but as low as 0.3 for the poorest economies. Because households in the poorest countries spend a high proportion of their budgets on food, and because food is essentially a private good, ‘economies of scale must be very limited, and θ should be set at or close to 1. In richer economies, θ would be lower, perhaps in the region of 0.75’ (p. 50). The World Bank classifies Malaysia as an upper-middle-income country, which suggests a choice of adult-equivalent parameters close to those proposed by Deaton and Zaidi for industrialized economies. In what follows, ∝ = 0.8 and θ = 0.8 are assumed.

Table 1 sets out adult-equivalent scales for households of different sizes and compositions. The per capita case is a restricted version of that of the NRC, with ∝ =θ= 1. If no allowance is made for economies of sale or differential needs of household members of different ages, a household of seven members (bottom row) is assumed to need seven times the income of a single-member household to enjoy the same standard of living.

Table 1 Adult-equivalent scales
1 PAKW = Perbelanjaan Asas Kehidupan Wajar, or Basic Expenditure for Decent Living; see text.


By the LIS approach, a household of seven members needs an income 2.65 times that of a one-person household. And the Oxford, OECD, and NRC adult equivalence scales imply that the same seven-member household requires, respectively, 4.2, 3.0, and 4.2 times the income of the one-member household to achieve the same standard of living.

The equivalence scales in the column headed PAKW are based on DOSM’s decent standard of living levels for households of differing size and composition (Exhibit 8 in DOSM, 2024, p. 55). For example, the mean income required by a one-member household to achieve a decent standard of living in 2023 was RM1,632. The income required for a household of two adults and one child to achieve the same standard is RM4,041. The implied adult-equivalent value is RM4,041/RM1,632 = 2.48. The Oxford and NRC scales are closest to it, which suggests that these are possibly preferred equivalence scales for Malaysia.

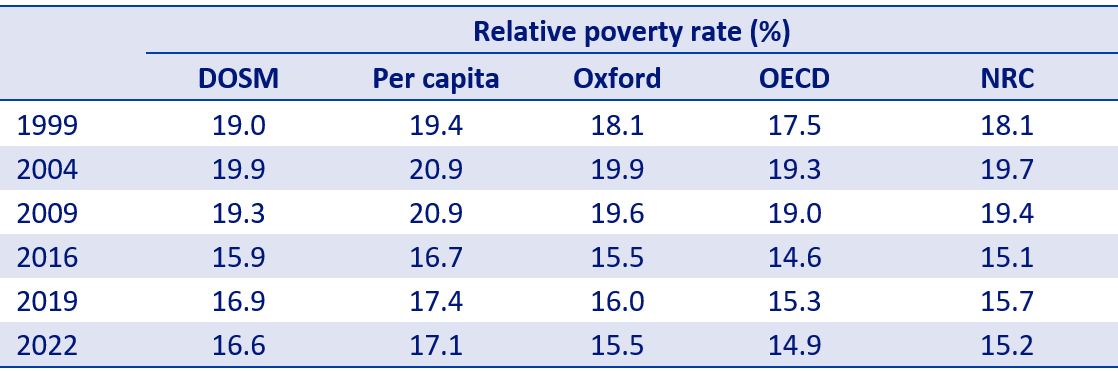
Malaysia’s relative poverty rates, 1999–2022

This section presents Malaysia’s relative poverty rates over the first two decades of the new millennium using DOSM’s series of household income surveys between 1999 and 2022. As the household demographic composition is recorded in these surveys, the LIS approach is not considered in what follows.

National relative poverty rates by the five approaches are set out in Table 2. The relative poverty rates in the second column are those published by DOSM (2024, Table 2.21, p. 102). While the alternative national relative poverty rates are similar, the DOSM approach differs from the others in that relative poverty rates are based on total household income. The rPLI in the DOSM approach is defined as 50 per cent of the median household’s total income, and the relative poverty rate is defined as the number of households with income below the rPLI divided by the total number of households. State-level relative poverty rates published by DOSM are based on rPLIs that vary by state rather than a single national standard—see Demery (2024) for details.

Table 2 Alternative measures of relative poverty using different equivalized scales


For the remaining four cases, the rPLI is defined as 50 per cent of the median individual’s per capita or equivalized income. The poverty rate in these cases is the number of individuals with per capita or equivalized income below the rPLI expressed as a percentage of the total number of individuals.

There are relatively minor differences in the national relative poverty rates across all five approaches—the DOSM and per capita cases are marginally higher than the other three in the latest 2022 survey.

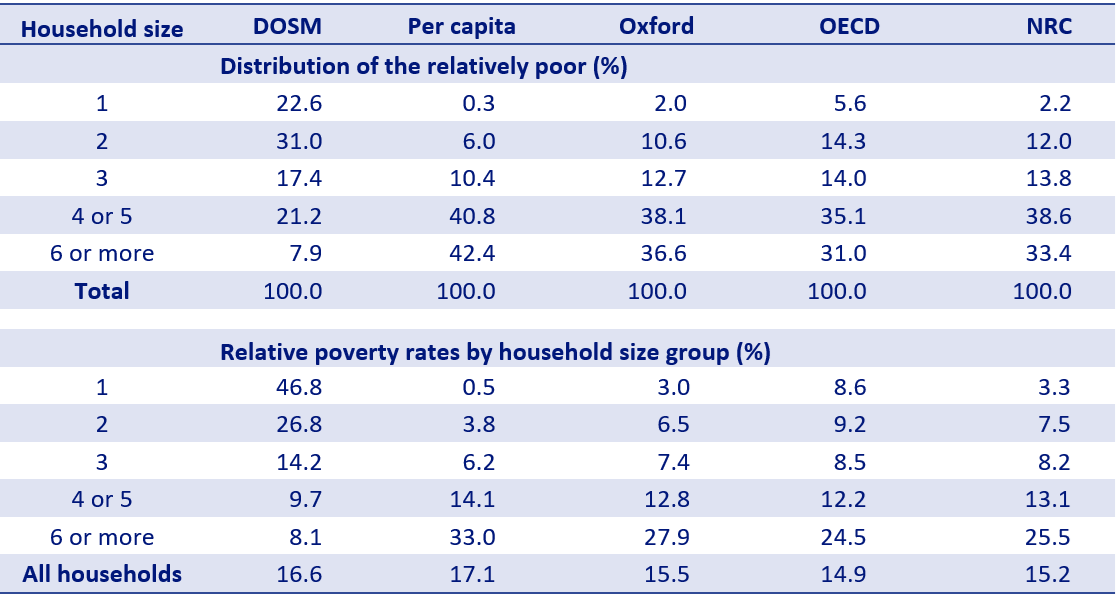
Malaysia’s relative poverty by household size

Although the ‘headline’ national poverty rates are similar, there are significant differences in their poverty profiles, especially in the part played by household size. Two perspectives reveal these differences. The first examines how the relatively poor are distributed by household size. The second compares relative poverty rates within each household-size subgroup—for example, the proportion of all three-member households that are in relative poverty. Details of these approaches based on the 2022 Household Income Survey are set out in Table 3—a similar pattern emerges in earlier years.

Looking first at the DOSM approach, the top panel of Table 3 sets out the distribution of relatively poor households by their size. According to this approach, over half of relatively poor households are small—one or two members—and less than 8 per cent of poor households have six or more members.

The bottom panel sets out the relative poverty rates for each household subgroup. In the DOSM approach, close to half of Malaysia’s single-member households are in relative poverty and over a quarter of two-member households are poor. Only 8 per cent of the largest households are relatively poor. By the DOSM approach, relative poverty is concentrated in small households. This is, however, a misleading message to give to policymakers.

Table 3 Relative poverty and household size, 2022 Household Income Survey


Consider next the per capita income approach. Individuals are poor if their household’s income per member is below half the median individual’s income per capita. The pattern observed in the DOSM approach is reversed. Only 6.3 per cent of poor individuals live in one- or two-member households and 83.2 per cent of poor individuals live in households of four or more members (upper panel). A third of the largest households are in relative poverty and less than 1 per cent of single-member households are relatively poor (lower panel). The incidence of relative poverty by the DOSM approach gives decidedly unreasonable profiles by household size. Those in the per capita case are more to be expected. Moving from total household income to income per member would be a substantial improvement.

The three adult-equivalent scales give similar results, both for the national poverty rate and its distribution by household size. Between two-thirds and three-quarters of relatively poor households are the larger ones (four or more members). A quarter of the largest households (six or more) are relatively poor by the three adult-equivalent scales, compared with one-third in the per capita case. The differences between poverty profiles in the DOSM and per capita cases are very marked, and those between the per capita and equivalized income cases are clear but far less pronounced.

A good case can be made for relative poverty to be based on the NRC equivalence scale as it is closest to the adult equivalence scale implied by DOSM’s decent living standard.

Conclusion

When determining which households are poor, it is clearly important for development policy and targeted anti-poverty programmes to take into account each household’s size and composition. Malaysia’s hard-core and absolute poverty line incomes do just that. And the income level that defines a ‘decent standard of living’ also varies with the household’s size and composition, as it does in the ILO approach being followed. Household size and composition play no role in defining DOSM’s relative poverty line income.

Basing the relative poverty line on total household income inevitably associates poverty with small households. By this approach, in 2022 three-quarters of relatively poor households had only one or two members. Basing the relative poverty line on per capita income is a substantial improvement but, by ignoring the differential needs of household members by age and potential gains from ‘economies of scale’, it associates poverty more with larger households than might be considered reasonable.

Income per adult equivalent is widely used in poverty and income-inequality analysis as it takes account of economies of scale enjoyed by larger households and the differential needs of household members that vary with age. The main challenge is to identify an adult-equivalent scale appropriate for Malaysia. The NRC approach has the advantage of flexibility and is closest to the scale implied by DOSM’s decent standard of living.
Further reading:

Aldi, J., Hagenaars, M., de Vos, K., and Zaidi, M. A. 1994. Poverty Statistics in the Late 1980s, Research based on micro-data. Luxembourg: Office for Official Publications of the European Communities.

Deaton, A. S. and Muellbauer, J. 1986. ‘On Measuring Child Costs: With Applications to Poor Countries’, Journal of Political Economy, Vol. 94, No. 4, pp. 720–744.

Deaton, A. S. and Zaidi, S. 2001. ‘Guidelines for Constructing Consumption Aggregates for Welfare Analysis’, Living Standards Measurement Study, Working Paper No. 135. Washington, DC: World Bank.

Demery, D. 2024. ‘Changing perspectives on Malaysia’s Poverty Line Income’. Economic History of Malaysia Project, https://www.ehm.my/home

Department of Statistics–Malaysia (DOSM). 2024. Cost of Living Indicators: Malaysia 2023. Online version.

International Labour Organization (ILO). 2021. A methodology to estimate the needs of workers and their families. Geneva: International Labour Office. Online version.

Jesuit, D. and Mahler, V. 2004. ‘State Redistribution in Comparative Perspective: A Cross-National Analysis of the Developed Countries’, Working Paper No. 392, Luxembourg Income Study Working Paper Series.

National Research Council. 1995. Measuring poverty: a new approach. Washington, DC: National Academy Press.

Organisation for Economic Co-operation and Development (OECD). 1982. The OECD List of Social Indicators. Paris: Organisation for Economic Co-operation and Development.

SHARE THIS PAGE
RELATED SITES

ECONOMIC HISTORY OF MALAYSIA
c/o Asia-Europe Institute
University of Malaya,
50603 Kuala Lumpur

Install EHM PWA App

Ooops!
Generic Popup2