Articles
Changing perspectives on Malaysia’s Poverty Line Income

Dr David Demery, Former Research Fellow, University of Bristol, United Kingdom

The reduction and eventual eradication of ‘absolute’ poverty and the creation of a more equitable society have been a primary political and policy focus of Malaysia’s state-led development planning for more than half a century. At independence in 1957, there were substantial disparities in income levels, in access to health care services, and in schooling, especially between rural and urban areas and between and within ethnic communities. The early Malaya/Malaysia Five-Year Development Plans set out pro-poor programmes to try to help ensure a fairer society, and the goal to eradicate absolute poverty was articulated in the 1971 New Economic Policy (NEP), with time-bound quantitative targets set out in subsequent national plans.

Since the 1970s, Malaysia has been measuring and monitoring the incidence of absolute poverty to evaluate the effectiveness of its policies and antipoverty initiatives. It has done this using a basic needs–based approach with absolute poverty determined by reference to an official poverty line income (PLI). The PLI is fixed in terms of income, that is, the flow of income received—rather than consumption or expenditure—adjusted over time for changes in prices as measured by the Consumer Price Index, on the assumption that this index captures the effects of inflation on the poor.

This article outlines the key methodologies used in determining the PLI, and how these have evolved over time—the latest in 2019 when Malaysia’s PLI was raised. It concludes by reflecting on alternative monetary approaches to defining the poverty line using relative poverty measures. For a broader discussion of (a) the conceptual challenges in defining and measuring poverty nationally and internationally, as well as the use of non-monetary multidimensional measures of poverty, see Deaton (2013) and Atkinson (2019); (b) Malaysia’s income inequality historically, see Sultan Nazrin Shah (2019); and (c) international and historical approaches, see Piketty (2014) and Milanovic (2023). 

Sudhir Anand’s pioneering measurement of national income poverty

In the 1970s, Oxford economist Sudhir Anand (1977; 1983) undertook a comprehensive analysis of inequality and poverty in Malaysia using income data from the 1970 Post-Enumeration Survey (PES), conducted on about 1.5 per cent of the population in Peninsular Malaysia, to check on the content and coverage of the country’s 1970 population census. Because the PES collected detailed statistical information on household income specified in broad categories, Anand could use it to analyse income inequality and poverty—although the available data were less disaggregated than in modern Household Income Surveys.1  While income data had been collected in an earlier 1957–1958 Household Budget Survey, the definition of income was limited and there were deficiencies in sample coverage. He considered state, urban/rural, and ethnic differentials in poverty, as well income levels of sub-groups such as farmers, fishermen, and rubber tappers, using relative and absolute definitions, the latter based on a PLI with food and non-food components, the latter determined by Malaysia’s Ministry of Welfare Services.

Interestingly, for 1970 the two approaches gave much the same result. The PLI in both was RM25 per month for per capita household income (Anand, 1983, p. 118). The mean income of individuals was RM50 per month, so Anand’s PLI was 50 per cent of the mean. In 1970, he estimated that 40 per cent of individuals lived in households with a per capita income of RM25 or less and that 36.5 per cent of households were poor, a rate lower than that for individuals, as poor households were larger.

Based on a higher PLI of RM33, adjusted after the 1977 revision of the PLI (see below), Anand estimated a 1970 poverty rate of 49.3 per cent for Peninsular Malaysia, with sharply higher rates for Malays than for the Indian and Chinese communities (Anand, 1983, p. 133). Anand’s estimates have been taken as the official baseline for assessing progress in poverty reduction since the NEP.

1977 PLI methodology

Using Anand’s pioneering analysis, in 1977 the Economic Planning Unit–Malaysia (EPU) defined the official PLI based on a household of five persons, which was Malaysia’s average household size at that time. Food and non-food needs were identified separately in this PLI. A food basket was ‘priced up’—one that delivered 9,910 kcals—and an additional 10 per cent was added to allow for condiments and a margin of safety. Non-food requirements were based on spending of households with income below RM200 per month, except for clothing and footwear where the Ministry of Welfare Services provided the necessary figure.

A household with income below the sum of the food component (RM160 per month) and the non-food component (RM92.36 per month) was in absolute poverty. The PLI for this five-member household was around RM50 per person per month in 1977. Expressed in 1970 prices this would have been RM30.6 in 1970, around 20 per cent higher than Anand’s initial PLI.

This 1977 approach had one obvious weakness, however: it took no account of variations in household size and age-sex composition. A very large household might well be classified as non-poor if it had the income necessary to support the smaller reference household. And a comfortably off single-member household could well be classified as poor if it lacked the resources to support a five-member household. The 1977 PLI also took no account of variations in consumer prices by state and urban/rural location, other than to treat Peninsular Malaysia, Sabah, and Sarawak separately.

A longhouse settlement of the poor indigenous community in Sarawak, 1990s
Source:
Encyclopaedia Britannica, 2001


2005 PLI methodology

In 2005 the EPU, DOSM, and Malaysia’s United Nations Development Programme (UNDP) substantially revised and improved the measurement of poverty (UNDP, 2007). A PLI was defined for each household to reflect its size, composition, and location (state and urban/rural so as to reflect differences in prices) to overcome the weaknesses in the 1977 methodology.

The food component of the PLI was based on the nutritional needs of household members. The EPU sought advice from nutritionists and medical professionals from the Ministry of Health and academia (Universiti Kebangsaan Malaysia and Universiti Putra Malaysia). The foods selected provided a balanced diet consisting of a variety of Malaysian foods to provide 10–20 per cent of calories from protein, 20–30 per cent of calories from fat and 50–60 per cent of calories from carbohydrates. If there was a choice of food quality, the lower price was selected.

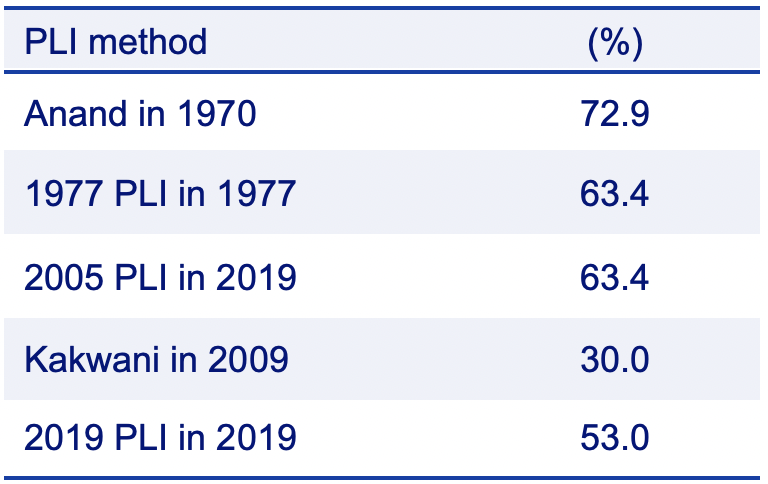
Nutritional science lay behind the food component of the PLI but there was little science to guide the non-food component. Martin Ravallion (1998), one of the world’s leading experts on measuring national and international poverty, had proposed two approaches to the non-food component. In an upper-bound case, the non-food PLI is based on the non-food spending of households whose food spending was close to the food PLI. In a lower-bound case, the non-food PLI is based on the non-food spending of households whose total expenditure was close to the food PLI. In determining the 2005 PLI, the National Steering Committee considered both options. It was concerned that the food share of the selected households using Ravallion’s upper-bound was too low (37 per cent). The Committee opted for a modified lower-bound: the non-food PLI was based on the non-food spending of households whose total spending was 20 per cent higher than the food PLI. The food share using this modified lower bound was 63 per cent.

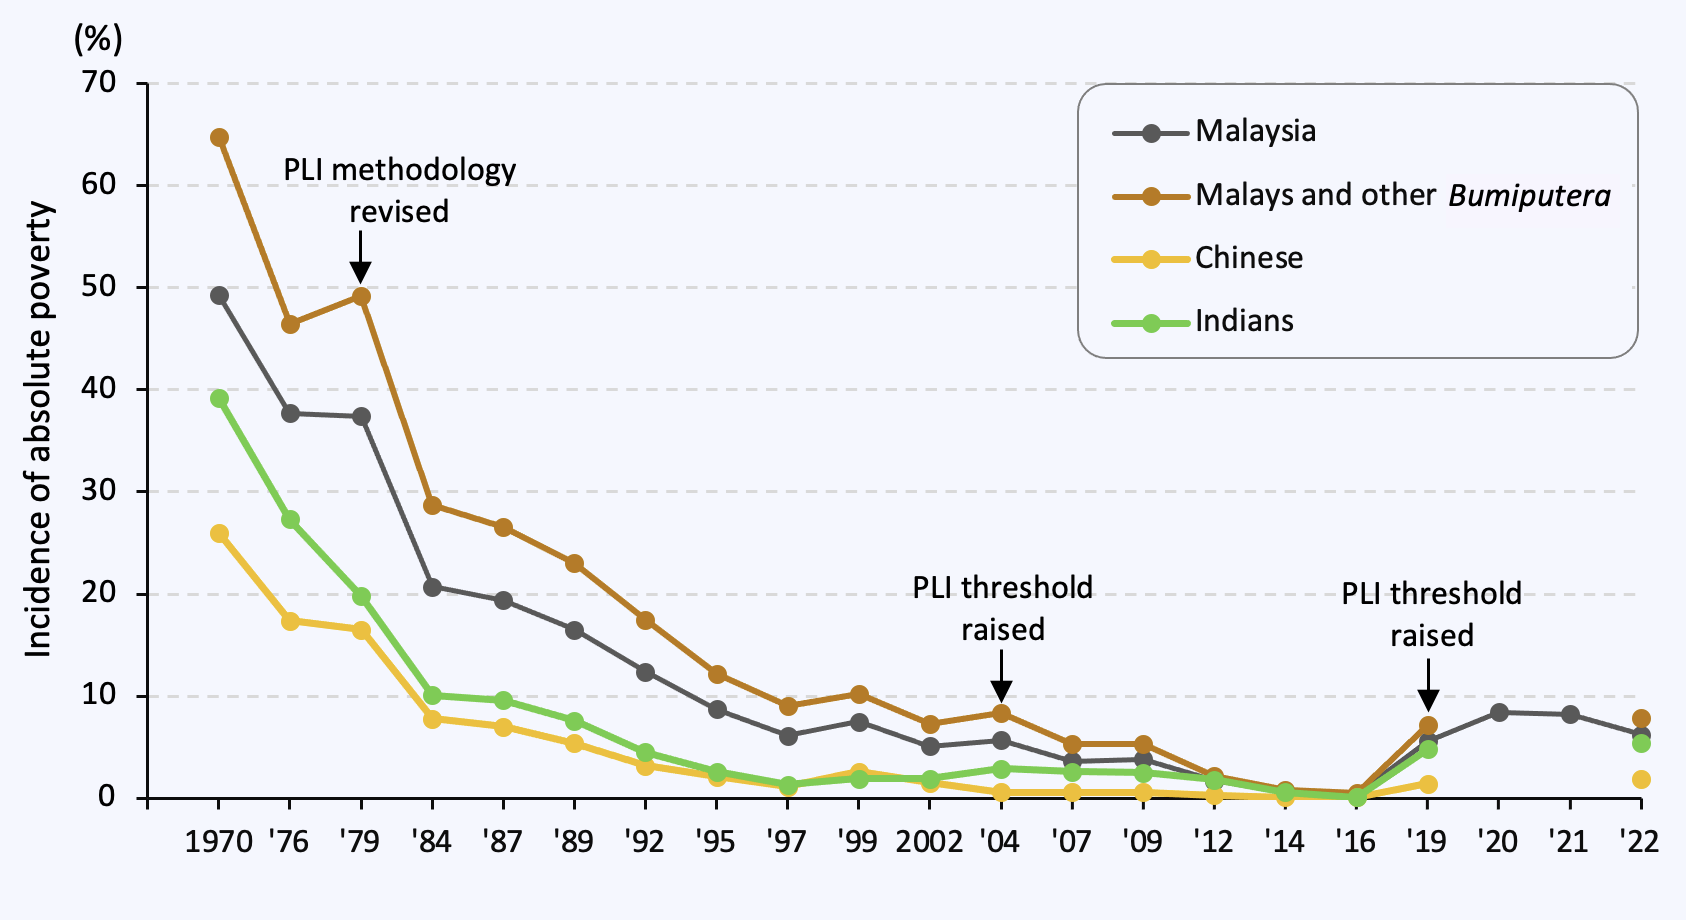
Absolute poverty as defined by the 2005 methodology fell sharply as the Malaysian economy continued to grow fairly strongly in the new millennium, except during the 2008 Global Financial Crisis. Close to 6 per cent of households were poor in 2004, falling to only 0.2 per cent in 2019. Absolute poverty by the 2005 standard had been eliminated.

Assessment of the 2005 PLI methodology

In 2012, at the EPU’s request, UNDP Malaysia engaged Professor Nanak Kakwani to appraise the 2005 methodology (see Kakwani, 2012). He adopted a ‘welfarist’ approach (Ravallion, 1994) where the PLI has to be consistent with microeconomic theory. This contrasts with Amartya Sen’s (1992) ‘capability’ approach where, for example, the food component could well include foods determined by nutritional experts rather than those chosen by households themselves. Kakwani’s review was wide-ranging, but he raised two broad areas of concern. First, the foods priced for the food component should be those typically bought by low-income Malaysian households themselves. Secondly, Ravallion’s lower bound was not consistent with consumer theory, whereas the upper bound was.

The author, as a member of the UNDP team that assisted the EPU and DOSM in 2005, was asked to comment on Kakwani’s review (Demery, 2013). The availability of both Household Income and Household Expenditure Surveys in 2009 made it possible to illustrate the impact of Kakwani’s suggestions. The published poverty rate for Malaysia in 2009 using the 2005 methodology was 3.8 per cent. If both of Kakwani’s criticisms were applied and rectified, the poverty rate would have been much higher at 12 per cent, if food prices faced by poorer households were below average (Demery, 2013, Table 9).

The 2005 standard was also criticized by Martin Ravallion in Kuala Lumpur early in 2019 as the visiting Royal Ungku Aziz Professor at the Universiti Malaya. He argued that the Malaysian PLI should be three times the level set by the 2005 methodology. His reason for choosing a multiple of three was based on his cross-country analysis with Shaohua Chen (Ravallion and Chen, 2017), in which they observed that countries with higher levels of mean income tended to adopt higher national poverty lines. A relationship between the two was estimated using observations for 146 countries and shown graphically for the 122 non-OECD countries as the red line in Figure 1.

Malaysia was not in Ravallion and Chen’s dataset, but in January 2019 Ravallion superimposed Malaysia’s data points on Figure 1, as shown. In 2011, Malaysia’s mean poverty line was RM800 per month, RM6.41 per person per day or US$4 per person per day at the 2011 purchasing power parity (PPP) exchange rate. In that year, the log of Malaysia’s mean income per person per day was 3.33. Based on his analysis with Chen, Ravallion argued that a poverty line of around US$12 would be expected—three times as great as its level in 2011.

The strong linear relationship between mean income and the PLI was clear over the full sample, but far less so over the 122 non-OECD countries in Figure 1. There is considerable variability around the fitted line, especially for the richer countries in this non-OECD sub-sample. Countries with similar levels of mean income to Malaysia’s adopted a range of poverty lines—Malaysia is thus not the only outlier. Cross-country comparisons of this sort offer an interesting but hazy guideline at best.

Figure 1 National PLIs and mean income
 Source: Ravallion (2019), https://economicsandpoverty.com/2019/01/21/has-malaysia-virtually-eliminated-poverty/.


2019 PLI methodology

After much pressing from parliamentary and civil society groups, as well as strident criticism by the United Nations Special Rapporteur on extreme poverty and human rights (Alston, 2019) over the country’s ‘unrealistic’ low PLI in relation to its income level, and the severe hardships and deprivations faced by many whose income was just above it, in July 2019 the EPU and DOSM once again embarked on a process to revise the definition of absolute poverty. The new approach was like that of 2005 but the components selected for inclusion in the food and non-food PLIs were revised, and the weight of the non-food component was significantly increased: 
  • The foods selected for the revised food PLI were determined primarily by their impact on health, with Malaysia’s Ministry of Health playing a key role in determining which foods to include. The revised mean food PLI at the national level in 2019 was RM1,170 per month, compared with RM623 using the 2005 selection of foods.
  • The selection of non-foods was also revised upwards in 2019, with a greater emphasis on quality and using the spending patterns of the bottom 20 per cent of households. A total of 146 non-food items were selected, compared with 106 items in the 2005 methodology. The revised average non-food PLI for households at the national level in 2019 was RM1,038 per month, compared with RM360 in the 2005 methodology.
  • The revised Malaysian PLI for the average household in 2019 was RM2,208, over twice its level using the 2005 methodology of RM983. Applying the 2019 PPP exchange rate and given an average household size of 3.89, this corresponds to US$12 per person per day, compared with US$5 with the 2005 methodology.
Food share of the PLI
All approaches to defining Malaysia’s PLI follow the approach pioneered by Seebohm Rowntree (1901) in his analysis of poverty in York, United Kingdom. He priced food and non-food components to obtain the income required ‘for the maintenance of merely physical efficiency’ (p. 86). The food share in Rowntree’s PLI for a family of five (two adults and three children) living in York at the start of the 20th century was 59 per cent (12s. 9d. for food in a total PLI of 21s. 8d.) In Anand’s 1970 Malaysia PLI, the food share was well over two-thirds and the 1977 and 2005 methodologies both implied food shares of the PLI close to two-thirds. The methodology proposed by Kakwani implied a food share of just below one-third in 2009 (Table 1). In the latest revisions of the PLI in 2019, the food share was just above one-half.

Table 1 Share of food component of Malaysia's PLI

Source: Compiled by author.

Unlike most other developed countries, the United States has adopted an absolute PLI and the food share in the US PLI has always been its key feature. The distinguished American economist Mollie Orshansky was largely responsible for defining the US PLI in the 1960s. To define the absolute PLI for a family of three or four, Orshansky (1965) multiplied the lowest-cost, minimally nutritious food diet by three; hence the food share in the US PLI was one-third.

Orshansky defended this focus on food share with an argument that has wider relevance. Orshansky’s poverty line goes further than Rowntree’s ‘maintenance of merely physical efficiency’. In her words, it should ensure that ‘everyone has the right to share in the good things of life. Yet there are still many who must watch America’s parade of progress from the sidelines, as they wait for their turn – a turn that does not come’ (Orshansky, 1965, p. 3). Food is only one dimension of the good life. Orshansky’s motivation has a contemporary relevance for Malaysia. The food share of the latest 2019 Malaysian PLI remains well above Orshansky’s one-third. This is surely where future revisions to the country’s absolute PLI will focus.

Absolute poverty declines

Figure 2 shows that despite the various revisions in the PLI, Malaysia’s absolute poverty rates have fallen markedly over the past 50 years, as to be expected given high rates of pro-poor economic growth and better paid employment opportunities. The rise in the estimated national poverty rates in 2020 and 2021 (8.4 and 8.2 per cent respectively) was linked to the COVID-19 pandemic, and the rate declined to 6.2 per cent when more normal conditions prevailed in 2022.

Figure 2 Malaysia’s absolute poverty rate by ethnic group of head of household, 1970–2022
Source of data: Official Portal of Ministry of Economy, 
                                  https://www.ekonomi.gov.my/en/socio-economic-statistics/household-income-poverty-and-household-expenditure
Notes: 1970 data relate to Peninsular Malaysia only.
               Starting in 1989, rates are for Malaysian citizens.
               Poverty rates in 1999–2016 are based on PLI 2005 Methodology.
               Poverty rates in 2019–2022 are based on PLI 2019 Methodology.
               Malaysia poverty rates in 2020 and 2021 are estimated (Department of Statistics–Malaysia (2023), Poverty in Malaysia 2022 
               (Putrajaya: Department of Statistics–Malaysia), Chart 2, p. 38).

An interesting feature is just how much ethnic differences in poverty rates have narrowed between Malaysia’s three main communities. Nevertheless, in 2022 the Bumiputera poverty rate (7.9 per cent) was over four times higher than that of the Chinese (1.9 per cent). There remains an ethnic dimension to poverty (Sultan Nazrin Shah, 2019, p. 446), and this would be even better captured if the category ‘Malays and other Bumiputera’ could be disaggregated to distinguish between Malay and non-Malay Bumiputera—the Orang Asli and the indigenous communities of Sabah and Sarawak.

Poverty rates remain high in Sabah’s water villages
Source:
Channel News Asia, 2019


Relative poverty

PLIs in the European Union (EU) and the United Kingdom (UK) are defined in terms of median income. Households with an income below 60 per cent of the median are relatively poor. As the economy grows, the poverty line rises with it. In the EU and UK the household’s income is ‘equivalized’ to adjust for differences in household size and composition. Total household income is divided by the number of ‘adult equivalents’ in the household. A household is relatively poor if its equivalized income—not total income—is below the poverty line expressed in equivalized income terms.

DOSM now publishes relative poverty rates following a similar procedure, but household income is not adjusted to account for differences in size and composition. A household is in relative poverty if its total income is below 50 per cent of the total income of the median household. In 2022, DOSM reported relative poverty rates of 15.9, 16.9, and 16.6 per cent for 2016, 2019, and 2022. In the 2022 Household Income Survey, the household half-way through the distribution of total income had six members: two adults and four children aged 14, 11, 9, and 6.

To reflect the living standards of household members, total income should be equivalized (as in the EU and UK) or at least expressed in per capita terms (income per household member). In the EU and UK, income is equivalized using the modified scale from the OECD. This attaches a weight of 1.0 to the first adult, 0.5 to additional adults, 0.5 to children aged 14 and over, and 0.3 to each child aged under 14. The number of equivalent adults in the six-member median household described in the previous paragraph would be 2.9: 1 (first adult) plus 0.5 (second adult), plus 0.5 (14-year-old child), plus 0.9 (three children under 14). The total equivalence value of 2.9 shows that the household needs close to three times the income of a single adult household to achieve a comparable standard of living. Apart from single-member households, the number of adult equivalents is below the number of household members and, for a given total income, equivalized income will be higher than per capita income.

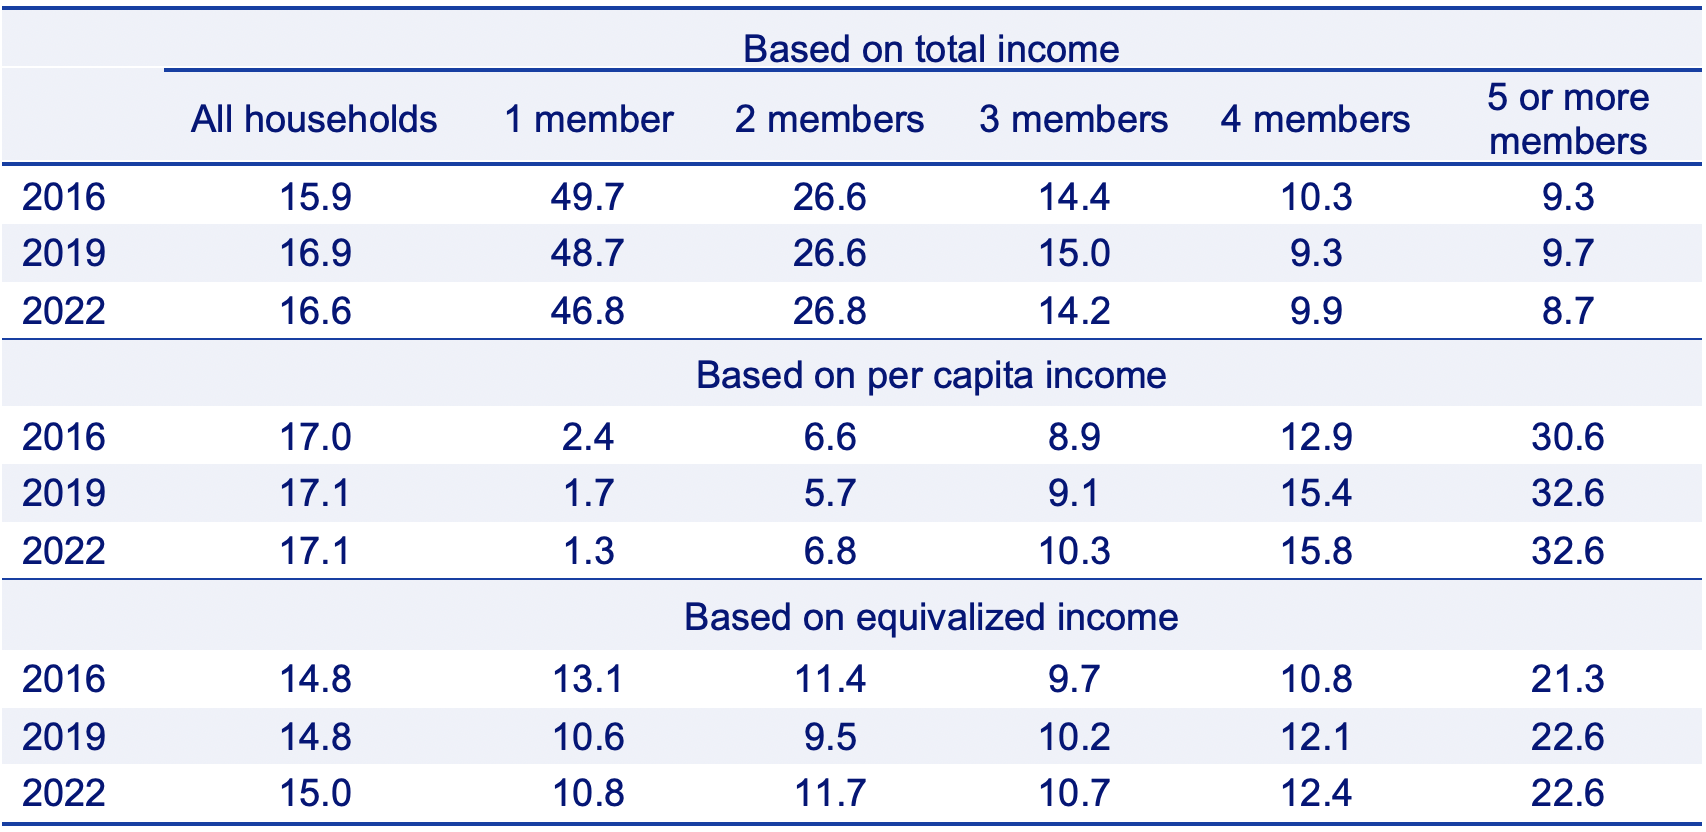
Relative poverty by household size

National relative poverty rates defined using per capita or equivalized income differ from those based on total household income (Table 2). In the per capita case they were a little higher (17.0, 17.1, and 17.1 per cent respectively in 2016, 2019, and 2022) and in the case of equivalized income a little lower (14.8, 14.8, and 15.0 per cent). More significantly, the DOSM approach gives a misleading impression of household characteristics that may lead to poverty. For example, DOSM reported relative poverty rates in 2016 and 2019 across households of different size (DOSM, 2020, Table 7.3). These are set out in the top panel of Table 2 together with estimates based on the 2022 Household Income Survey.

Table 2 Malaysia’s relative poverty rates (%) by household size 
Source: Compiled by author.


According to DOSM, close to half of single-member households are relatively poor, that is, they have total income less than half of median total income. And less than 10 per cent of households with five or more members are, by this criterion, in relative poverty. With the two more appropriate measures of household welfare—income per capita and income per adult equivalent—this feature is reversed. This is particularly true in the per capita income case where, in 2022 for example, around only 1 per cent of single-member households were relatively poor and close to one-third of households with five or more members were poor.

This reversal is also evident in the equivalized income case, but less emphatically. In 2022, just over 10 per cent of single-member households and 23 per cent of larger households were relatively poor. For a single-member household, income per capita and equivalized income are the same but median income per equivalent adult will be substantially above the per capita median because there are fewer ‘equivalent adults’ than members in the typical median household. Thus in 2022, the median household’s equivalized income is RM2,960 per month compared with the median per capita income of RM1,876. More single-member households will therefore have income below half the median in the case of equivalized income. 

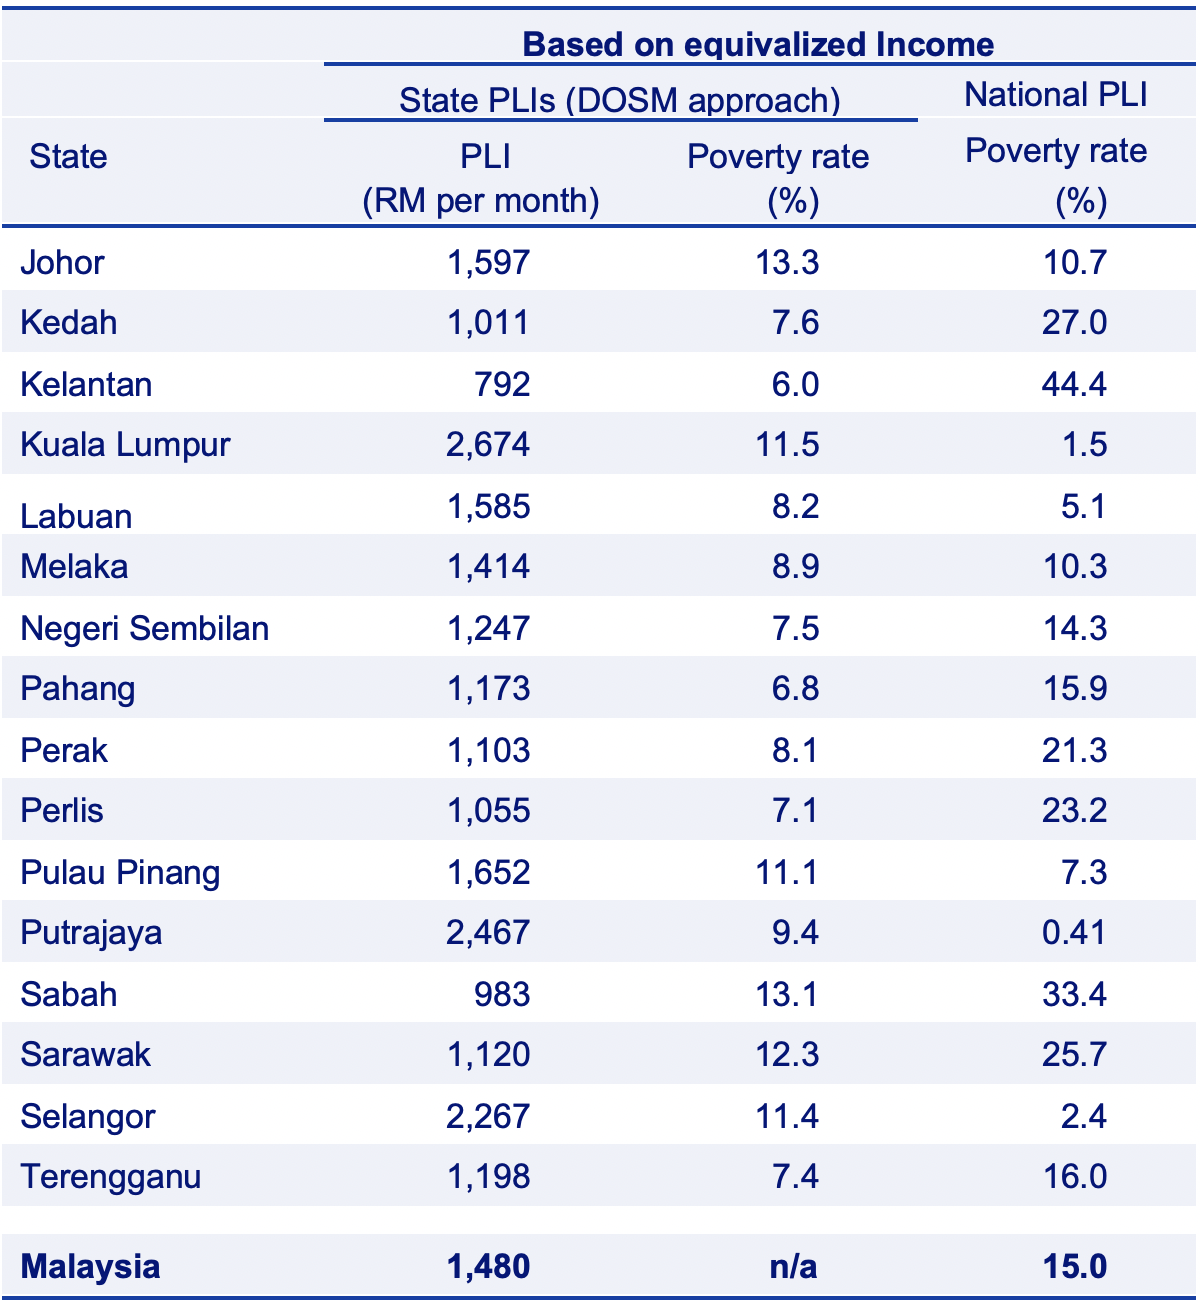
Relative poverty by state

When reporting relative poverty rates by state, DOSM allows for different poverty line thresholds in each state. When income is defined as total household income, a household in Putrajaya is relatively poor if its income is below RM5,028, whereas households in Kelantan are poor only if their income falls below RM1,807 (DOSM, 2023, Table 28). Each state has its own relative PLI and no national standard is applied. In the UK, regional and county poverty rates are based on the national median, not those for the region or county. For example, relative poverty in Wales is based on the UK median, not the Welsh median.

The relative poverty rates by state would look very different if the PLI were based on the median equivalized income over all Malaysians, as is evident from Table 3. The second column displays 50 per cent of each state’s own median equivalized monthly income, and the third the states’ relative poverty rates based on these thresholds. The fourth column sets out the relative poverty rates based on the national threshold (RM1,480 per equivalent adult per month). Households with equivalized incomes below this national standard are relatively poor.

Only 6.0 per cent of households in Kelantan have equivalized income below half of Kelantan’s own median income, but 44.4 per cent of households in Kelantan have equivalized income below the national threshold. Similarly, relative poverty rates are particularly higher in Perak, Perlis and (especially) Sabah and Sarawak (fourth column). In the richer federal territory of Putrajaya, the reverse applies: 9.4 per cent of households are relatively poor by the state’s own standard, but less than half of 1 per cent are relatively poor by the national standard. Kuala Lumpur and Selangor also have low relative poverty rates by the national standard.

Ravallion was no fan of the relative poverty approach. He and Chen argued that relative poverty ‘violates an intuitively appealing axiom, namely that if all incomes increase (decrease) by the same proportion then an aggregate poverty measure must fall (rise)’ (Ravallion and Chen, 2011, p. 1252). They proposed a ‘weakly relative’ poverty line based loosely on the way that poverty lines are related to mean incomes across countries. Because the EU and UK approach focuses on relative poverty, it is hardly surprising that poverty by this criterion remains unchanged when all incomes change in the same proportion. Interestingly, the UK also defines an absolute PLI set equal to 60 per cent of the median in a ‘base year’ (currently 2010/11). In subsequent years, households are defined as absolutely poor if their incomes are below 60 per cent of the base-year median.

Conclusion

In defining absolute poverty, there is a need to strike a balance between maintaining continuity of measurement with a defined basket of goods—food and non-food—remaining unchanged over time, and updating the basket in line with changing contemporary standards of living and consumption patterns—healthier diets and former ‘luxury’ goods becoming essential. Time tends to erode the relevance of any particular benchmark basket of goods, the choice of which will always contain an element of subjectivity, and a PLI needs to be reviewed as the poor are redefined socially.

The EPU and DOSM are to be applauded for timely revisions of the absolute poverty line, and for linking it to healthy and more comfortable living conditions as the country has become much more prosperous. By the latest 2019 approach, only 6.2 per cent of Malaysian households lived in poverty in 2022—an impressive achievement.
Table 3 Relative poverty rates (%) by state, 2022
Note: n/a = not applicable.
Source:
Compiled by author.

As Malaysia continues its transition from upper-middle-income to high-income status, measuring and monitoring relative poverty rates is a good step forward for determining the provision of welfare services and amenities for the most disadvantaged. But to sharpen policy focus, DOSM should reconsider its approach to measuring and reporting relative poverty, basing its analysis on equivalized or per capita household income, and it should better disaggregate data to support targeted anti-poverty programmes. In the UK, the absolute PLI is defined as the relative PLI in a base year. This consistent approach to absolute and relative poverty measurement has much to commend it for Malaysia.
Further reading:

Alston, P. 2019. Statement by Professor Philip Alston, United Nations Special Rapporteur on extreme poverty and human rights, on his visit to Malaysia, 13–23 August 2019.
https://www.ohchr.org/en/statements-and-speeches/2019/08/statement-professor-philip-alston-united-nations-special-rapporteur#:~:text=The%20purpose%20of%20a%20national,without%20having%20actually%20achieved%20it. 

Anand, S. 1977. ‘Aspects of Poverty in Malaysia’. Review of Income and Wealth, March, pp. 1–16.

______ 1983. Inequality and Poverty in Malaysia: Measurement and Decomposition. Washington, DC: Oxford University Press for the World Bank.

Atkinson, A. B. 2019. Measuring Poverty around the World. Princeton: Princeton University Press.

Deaton, A. 2013. The Great Escape: Health, Wealth, and the Origins of Inequality. New Jersey: Princeton University Press.

Demery, D. 2013. Revision of Malaysia’s Poverty Line Income. University of Bristol, mimeo.

Department of Statistics–Malaysia (DOSM). 2020. Household Income and Basic Amenities Survey Report. Putrajaya: DOSM.

______ 2023. Highlights: Income, Expenditure, Poverty, Inequality 2022. Putrajaya: DOSM.

Kakwani, N. 2012. Review of Malaysia’s Poverty Line Index. Report commissioned by UNDP, Malaysia.

Milanovic, B. 2023. Visions of Inequality: From the French Revolution to the End of the Cold War. Cambridge, Massachusetts: Belknap Press of Harvard University Press.

Orshansky, M. 1965. ‘Counting the Poor: Another Look at the Poverty Profile’, Social Security Bulletin, Vol. 28, No. 1, January 1965, pp. 3–29.

Piketty, T. 2014. Capital in the Twenty-First Century. Cambridge, MA: Harvard University Press.

Ravallion, M. 1994. Poverty Comparisons: Fundamentals of Pure and Applied Economics. Chur, Switzerland: Harwood Academic Press.

______ 1998. ‘Poverty Lines in Theory and Practice’. The World Bank Living Standards Measurement Study, Working Paper 133. Washington, DC: World Bank.

Ravallion, M. and Chen. S. 2011. ‘Weakly Relative Poverty’. The Review of Economics and Statistics, Vol. 93(4), November, pp. 1251–1261.

______ 2017. ‘Welfare-consistent Global Poverty Measures’. National Bureau of Economic Research Working Paper 23739.

Rowntree, B. S. 1901. Poverty, A Study of Town Life, London: Macmillan.

Sen, A. 1992. Inequality Re-examined. New York: Harvard University Press.

Sultan Nazrin Shah. 2019. Striving for Inclusive Development: From Pangkor to a Modern Malaysian State. Kuala Lumpur: Oxford University Press.

United Nations Development Programme (UNDP). 2007. Malaysia: Measuring and Monitoring Poverty and Inequality. Kuala Lumpur: UNDP.


Statistical information from the Household Income Surveys, conducted by the Department of Statistics–Malaysia (DOSM) and carried out every three years or so, are currently used to calculate poverty rates—the proportion of households with income below the PLI. Household income, the total income accruing to all household members, includes employment and self-employment incomes, property income, and transfers accruing to household members, both in cash and in kind, ‘on a regular basis in one year or more often’.


SHARE THIS PAGE
RELATED SITES

ECONOMIC HISTORY OF MALAYSIA
c/o Asia-Europe Institute
University of Malaya,
50603 Kuala Lumpur

Install EHM PWA App

Ooops!
Generic Popup